pymead.tutorials.curvature_comb_plotting#
Examples of plotting curvature combs for Bézier curves and airfoils. See the code below or by
clicking on main under “Functions” at the bottom and then clicking [source] next to the main function.
import numpy as np
from matplotlib.lines import Line2D
from matplotlib.pyplot import subplots, show, rcParams
from pymead.core.bezier import Bezier
from pymead.core.geometry_collection import GeometryCollection
from pymead.core.point import PointSequence
def main():
# Some plot settings:
rcParams["font.family"] = "serif"
curve_props = dict(color="cornflowerblue", lw=1.8)
normal_props = dict(color="mediumaquamarine", lw=0.8)
comb_props = dict(color="indianred", lw=0.8)
skeleton_props = dict(color="gray", lw=0.7, marker="x", mec="grey", mfc="grey")
title_props = dict(size=14)
fig, axs = subplots(2, 1)
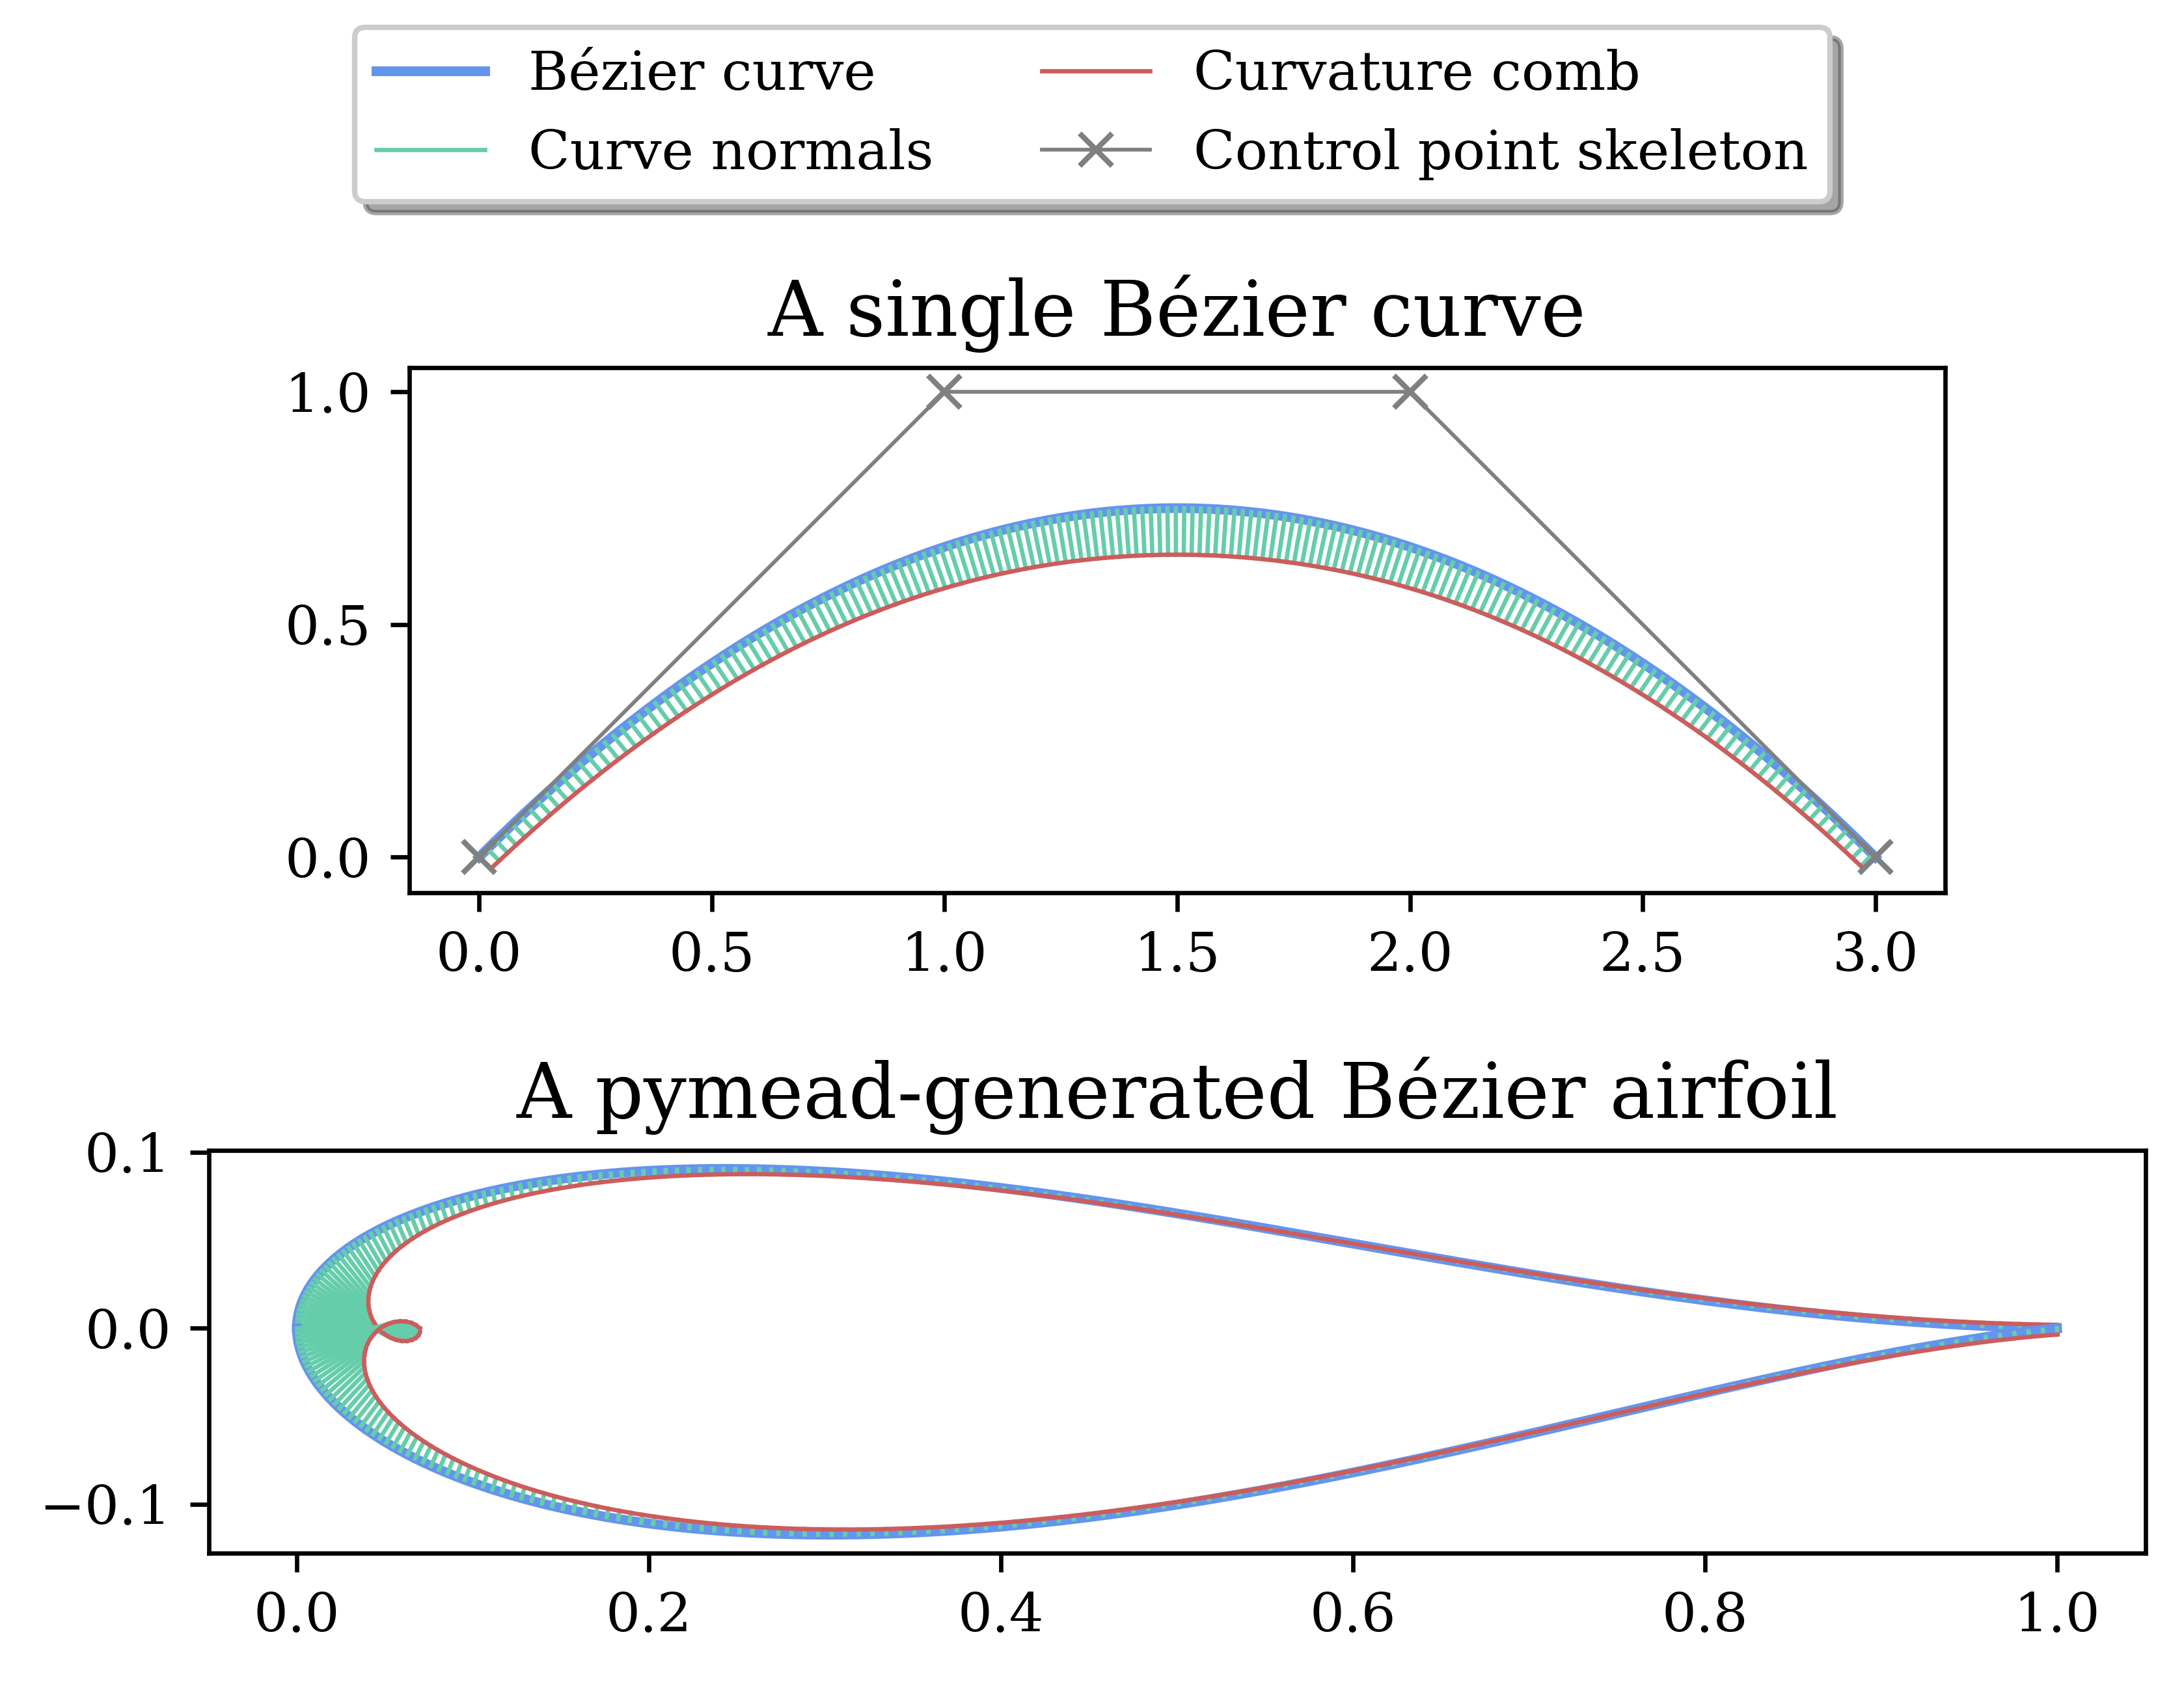
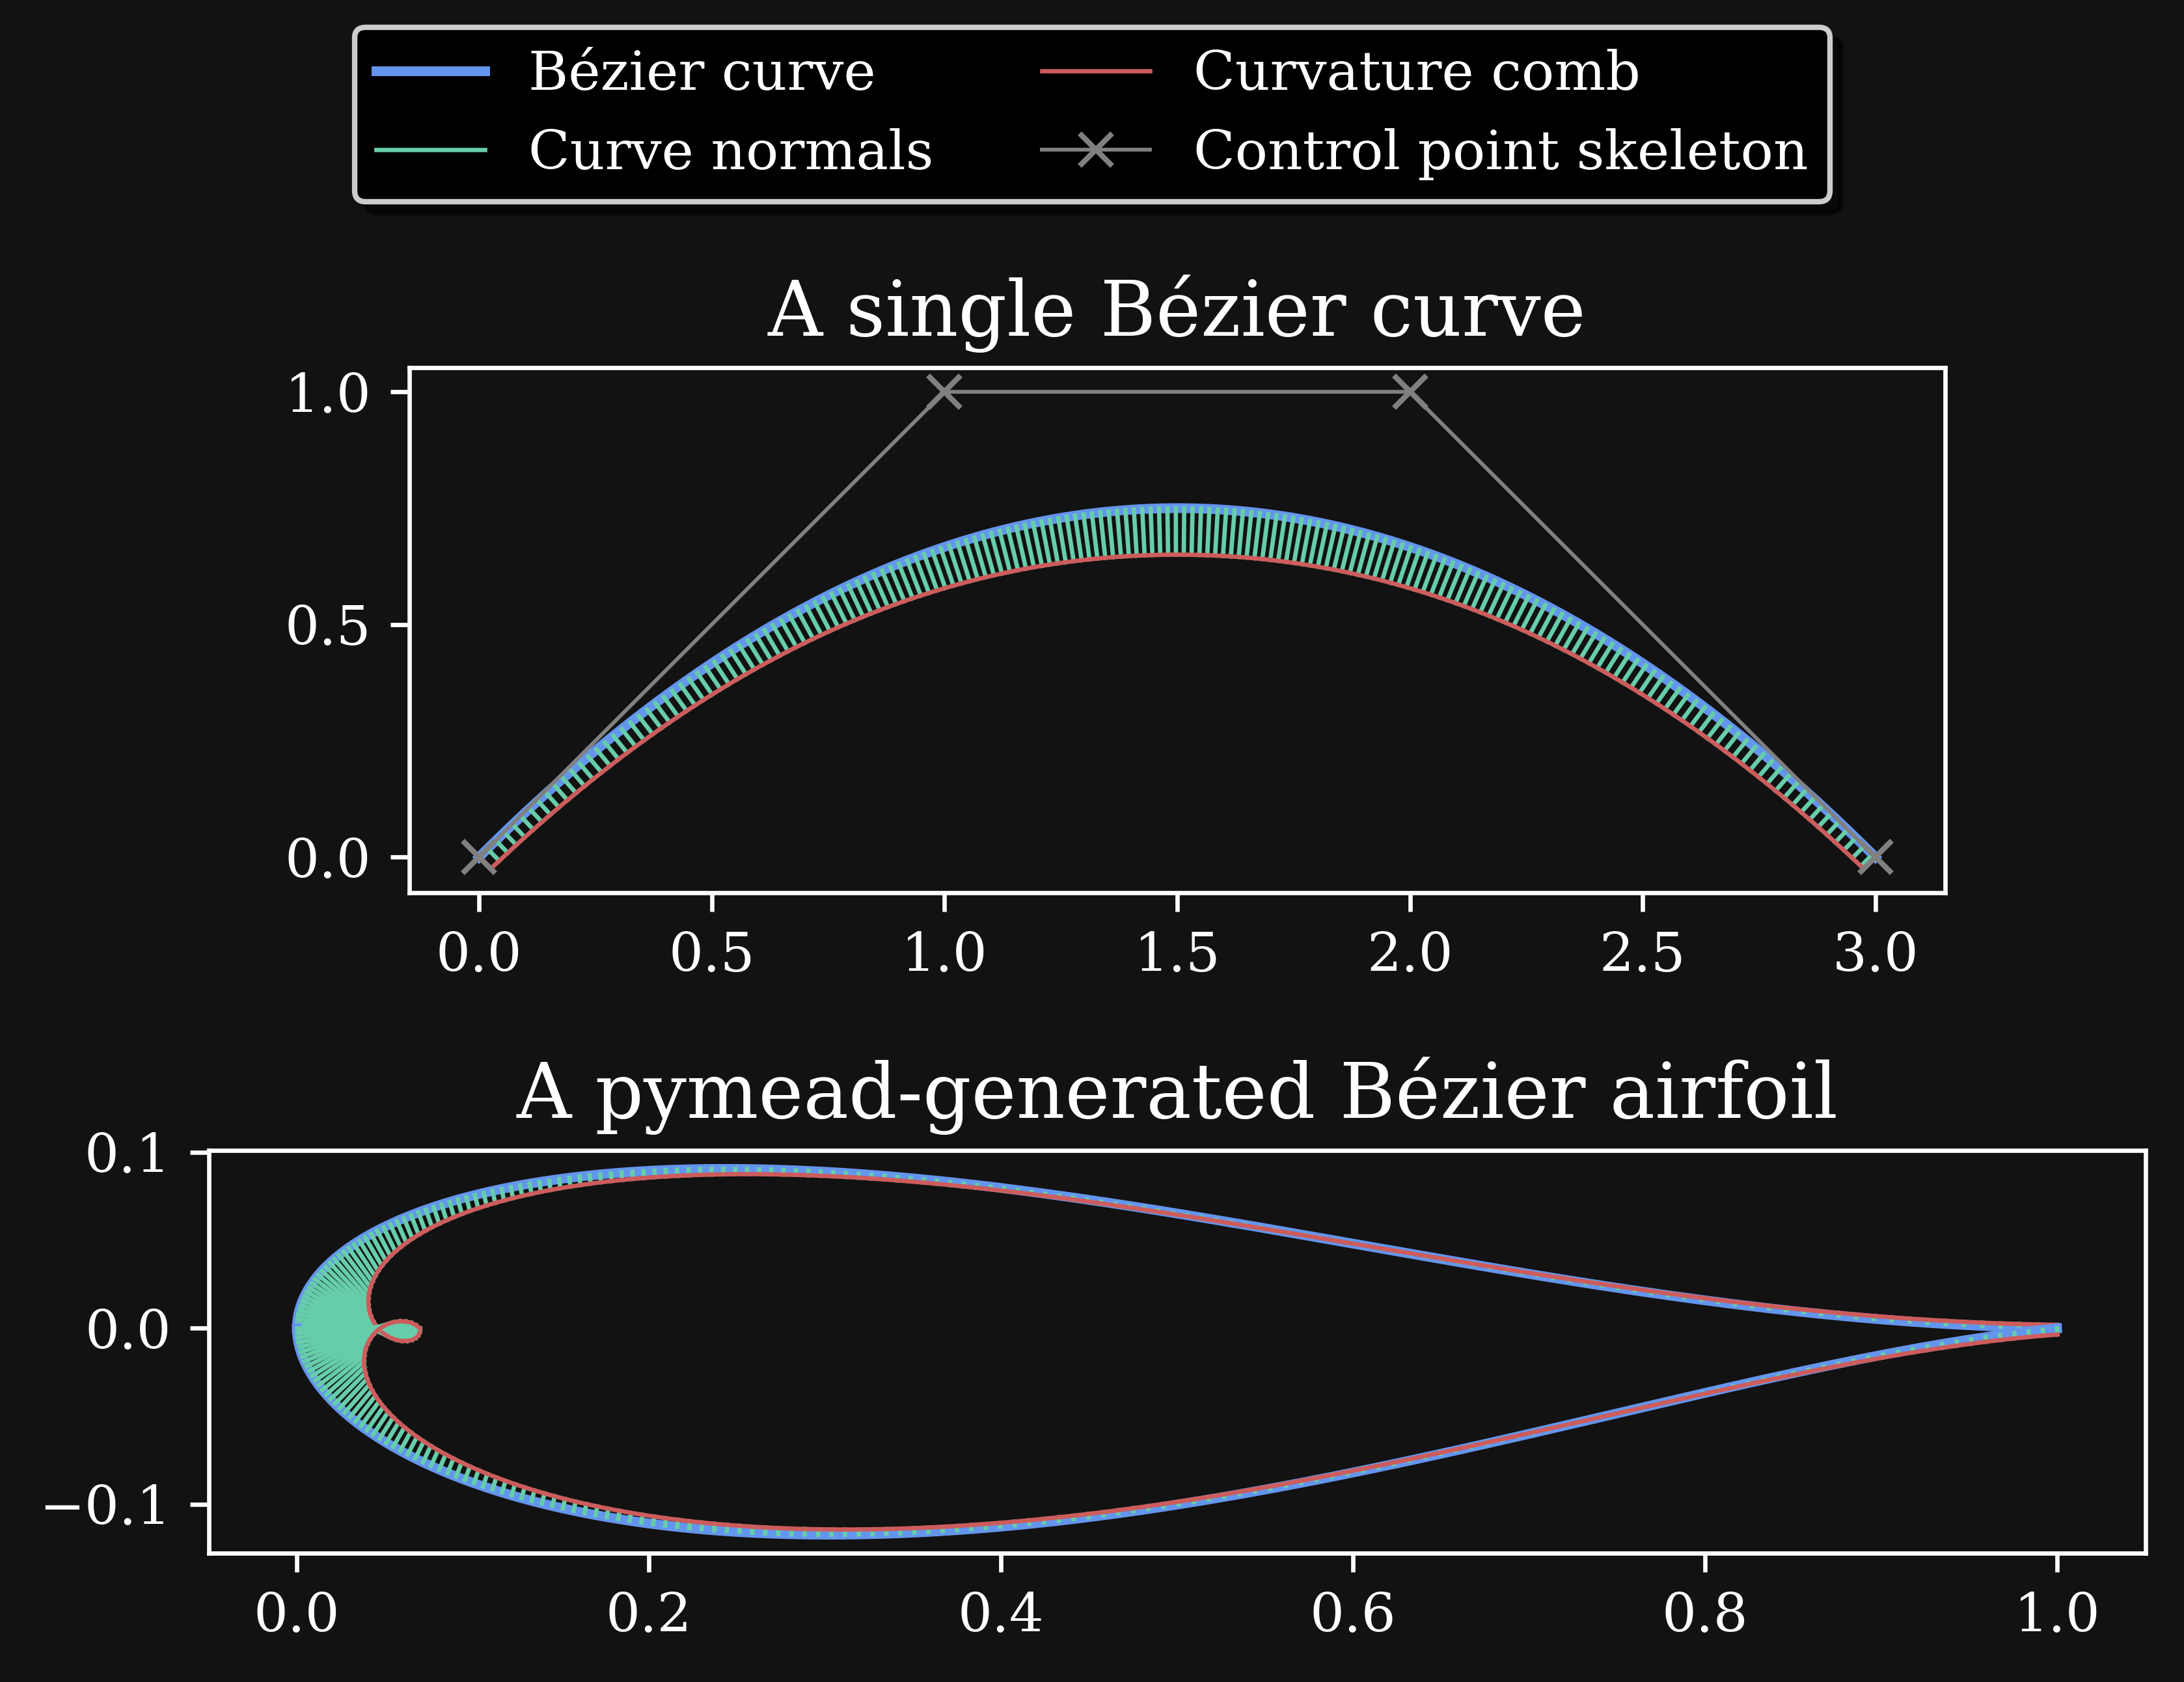
# Plot the curvature comb for a single Bézier curve on the first subplot:
C = Bezier(PointSequence.generate_from_array(np.array(
[[0.0, 0.0], [1.0, 1.0], [2.0, 1.0], [3.0, 0.0]])),
default_nt=500
)
P = C.get_control_point_array()
curve_data = C.evaluate()
scale_factor = 0.1 / np.max(abs(curve_data.k))
comb_tails, comb_heads = curve_data.get_curvature_comb(max_k_normalized_scale_factor=scale_factor, interval=3)
for comb_tail, comb_head in zip(comb_tails, comb_heads):
axs[0].plot([comb_tail[0], comb_head[0]], [comb_tail[1], comb_head[1]], **normal_props) # Plot the normals
curve_data.plot(axs[0], **curve_props) # Plot the curve
axs[0].plot(comb_heads[:, 0], comb_heads[:, 1], **comb_props) # Plot the curvature comb curve
axs[0].plot(P[:, 0], P[:, 1], **skeleton_props) # Plot the control point skeleton
axs[0].set_title("A single Bézier curve", **title_props)
# Create an airfoil and plot the curvature comb for all the airfoil curves on the second subplot:
geo_col = GeometryCollection.load_example("basic_airfoil_sharp")
airfoil = geo_col.container()["airfoils"]["Airfoil-1"]
for curve in airfoil.curves:
curve_data = curve.evaluate()
comb_tails, comb_heads = curve_data.get_curvature_comb(max_k_normalized_scale_factor=0.0005)
for comb_tail, comb_head in zip(comb_tails, comb_heads):
axs[1].plot([comb_tail[0], comb_head[0]], [comb_tail[1], comb_head[1]], **normal_props) # Plot the normals
curve_data.plot(axs[1], **curve_props) # Plot the curve
axs[1].plot(comb_heads[:, 0], comb_heads[:, 1], **comb_props) # Plot the curvature comb curve
for ax in axs:
ax.set_aspect("equal")
axs[1].set_title("A pymead-generated Bézier airfoil", **title_props)
# Create a legend on top:
labels = ["Bézier curve", "Curve normals", "Curvature comb", "Control point skeleton"]
prop_list = [curve_props, normal_props, comb_props, skeleton_props]
line_proxies = [Line2D([], [], **props) for props in prop_list]
box = axs[0].get_position()
axs[0].set_position([box.x0, box.y0, box.width, box.height * 0.8])
fig.legend(line_proxies, labels, ncol=2, fancybox=True, shadow=True, loc="upper center")
# Show the plot
show()
return fig, axs
if __name__ == "__main__":
main()
Functions
|